 This website was archived on January 11, 2020 and is no longer updated.
D.3 Step 3: Sampling – from whom do you collect your data?
Introduction
From the definition of your aims and from secondary research you should already have a group of people, organisations or maybe companies (so-called ‘elements’) in mind from whom you want to collect your data. We call this group the ‘population of interest’ (in some textbooks it is called the ‘target population’). If your group population of interest is rather small, it might be possible to collect data from all elements in this group – this is called a census. However, in most cases you will collect data from only a few elements – these then make up your sample. During sampling, you will also have to decide about your sampling unit: For example, the elements in your sample are individual people, but you might want to know about household spending on organic products. In this case, your sampling unit would be households. Sampling is easiest when you already have an existing sampling frame, which is a list of all the elements included in your population of interest (i.e. a list of all organic farmers in your country). If such a list does not yet exist, the phrase ‘sampling frame’ refers to the procedure of creating this list.
Figure D.3-1 presents the individual stages of the sampling process, all of which will be explained in more detail. As the sampling process is important for getting accurate and precise data, you should take a lot of care with it.
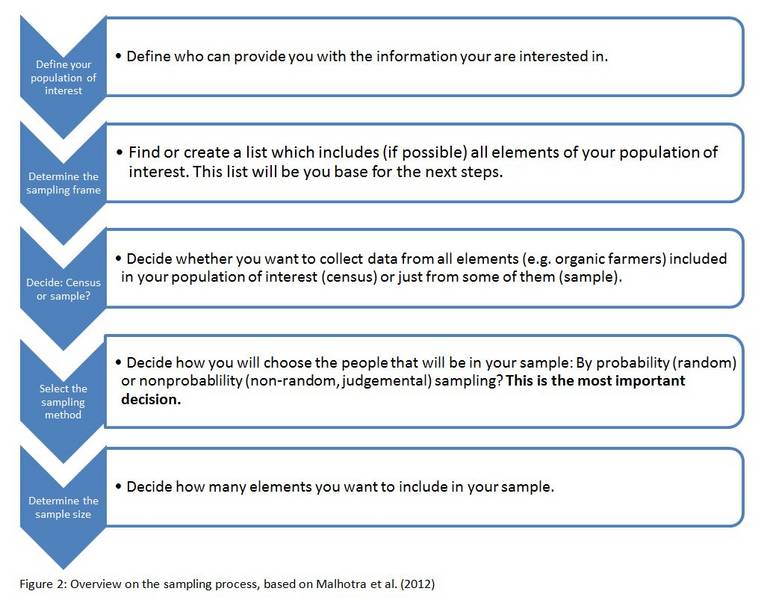

D.3.1 Stage 1 of sampling: Define your population of interest
At the first stage of the sampling process, you have to define your population of interest. Try to do this as precisely as possible. If you include too many elements, you will collect data from more elements than necessary, and some of them might not really be able to deliver the data you are interested in. Table D.3-1 shows you some examples of populations of interest for different types of market data.
Table D.3-1: Examples for populations of interest for the different types of organic market data
| Type of data | Population of interest |
|---|---|
| Production [areas/numbers] | Farmers, control and certification bodies |
| Production volumes | Farmers, control and certification bodies, organic farmers’ associations |
| Production values | Farmers, control and certification bodies, organic farmers’ associations |
| Retail volumes | Wholesalers/processors, retailers, market research institutes (panel/scanner data) |
| Retail values | Wholesalers/processors, retailers, market research institutes (panel/scanner data) |
| Catering volumes | Caterers, wholesalers, consumers |
| Catering values | Caterers, wholesalers, consumers |
| Import data | Wholesalers, importers, port/custom authorities, statistical authorities, statistics of exports in supply countries |
| Export data | Wholesalers, exporters, port/custom authorities, statistical authorities |
| Prices at farm level | Farmers/producers, market research institutes (price indices), market associations, regulatory boards, wholesalers, processors, agricultural stock exchanges |
| Retail prices | Retailers, market research institutes (price collectors, panel/scanner data) |
- Example
You want to collect data about the production volumes of organic goat cheese. If you define all organic farmers as the population of interest, most of them will not have any information on goat cheese, as they do not keep goats themselves and thus are not interested in that specific topic. On the other hand, if you decide to include only organic goat cheese producers from a certain region, the results may differ greatly from those of a nationwide survey.
D.3.2 Stage 2 of sampling: Determine the sampling frame
Once you have defined your population of interest, your next task is to find or create your sampling frame: a list of all elements which are part of this population. In some cases such a list may already exist, but in other cases you will have to create a list according to your research aims (e.g. through combining different lists that each only include part of your population of interest).
- Example
Your population of interest are all organic goat cheese producers in your country. Maybe you are lucky and someone else has just recently created such a list, which would then be your ready-to-use sampling frame. However, it is more likely that you do not have a complete list yet. In this case, you might collect names of organic goat cheese producers from different organic farmers’ or traders’ associations. You then enter these names into a new list, carefully checking for possible double counts of elements (for more information see Step 4, "Check for survey errors"). Additionally, you will have to make sure that your sampling frame (the list of organic goat cheese producers) is really complete before you use it, i.e. that you did not miss those goat cheese producers who are not members of an organic association.
In some cases it might not be possible to get a complete list of a certain population of interest. For example, this could be the case if you tried to create a list of all farm shops in your country: Many of them will not appear on any list, as they are not formally registered anywhere. Thus, nobody knows the real number of existing farm shops. In such circumstances, you will have to keep these shortcomings in mind, consider them during the next stages and communicate them when you publish your results.
D.3.3 Stage 3 of sampling: Decide - census or sample?
Now that you have a (hopefully complete) list of all elements included in your population of interest, as a next step you must decide whether to do a survey with everyone in it (census) or whether you only ask a smaller number of people in this group (sample). If you take a sample, the composition of the people in it should be as similar to the total population of interest as possible. While on the first view a census might generally seem to be the best choice, in many cases it is better to take a sample instead. A survey based on a sample can be conducted in a shorter time than a census and thus also reduces the work and effort involved. In the following checklist some factors are listed which help to decide between a sample and a census. You cannot decide between a census or a sample just based on one factor, but you need to consider all factors together.
Checklist: Should you do a census or take a sample?
- Small budget → sample
Large budget →census - Short time →sample
Long time → census - Large size of your population of interest→ sample
Small size of your population of interest → census - Small degree of accuracy needed (data only needed for first overview or basic information) → sample
- High degree of accuracy needed (important decisions will be taken based on data) → census
D.3.4 Stage 4 of sampling: Select the sampling method
If you have decided to take a sample instead of a census, you have to take one major decision about the sampling method. The key question at this point is: Do you want to do probability (random) or nonprobability (non-random) sampling?
Be aware: Only probability sampling can give representative results.
Figure D.3-2 gives an overview over the different sampling methods. Those ones relevant for organic market data collection will be explained in more detail.
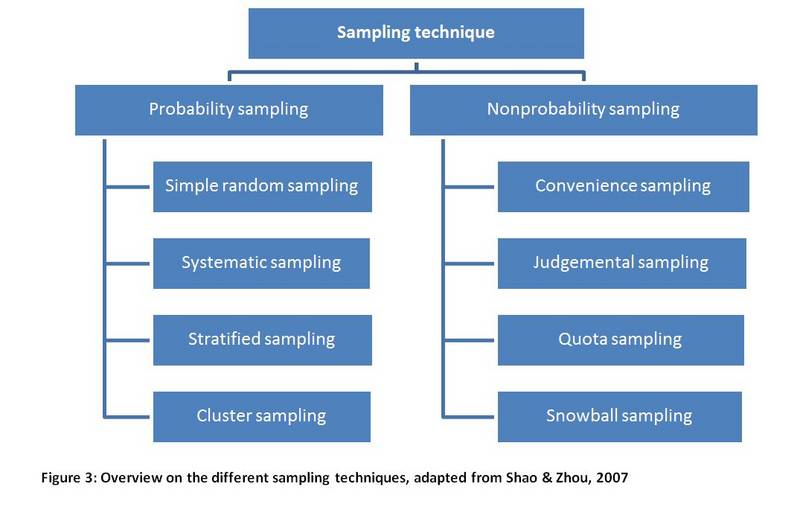
D.3.4.1 Probability sampling methods
The most important characteristic of probability sampling is the random choice of those elements which will be included in the sample. The random procedure ensures that every element in the population of interest has the same chance (= probability) of being part of the sample. Probabilty sampling methods are free from personal influences and biases, which is important for statistical analysis. You can only get representative results (results that you can generalize to your total population of interest) and calculate the (random) sampling error, with probability sampling. Sampling error occurs when the selected sample does not perfectly represent the total population of interest and its calculation expresses the difference between a result taken from a sample and the result that you would have obtained if you had done a census.
However, be aware that even a probability sample cannot be representative for all relevant variables (i.e. farm size, farm income and age of the farmer), but normally only for one or a few variables. Although it might seem obvious, these restrictions should be communicated later on in the publication of your survey, i.e. by stating that "the sample is representative with regard to farm size in hectares" if you have had a list of all farms and their sizes.
The most basic form of probability sampling is simple random sampling. For the collection of organic market data, stratified sampling and cluster sampling, as well as combinations of both, are often an appropriate choice. For additional information on the other sampling procedures, you can consult any of the many existing publications on these topics.
D.3.4.1.1 Simple random sampling
The easiest example for a simple random sampling procedure is a lottery draw, in which a bowl contains balls with different numbers (e.g. from 1 to 49) and some of these are randomly (e.g. blindly) chosen. In this lottery example, the 49 balls are the sampling frame, each ball being one element.
- Example: How to conduct simple random sampling with Excel
For your organic market data collection, you have a complete list of organic on-farm processors which has been sent to you via fax. To conduct simple random sampling, you should have this list as an Excel file (or as a similar spreadsheet programme file). Write each element (each processor) in a single row, with the different characteristics and data types (e.g. size in ha, turnover in national currency, production volume in tons etc.) in separate columns. Number all elements (each row), starting with 1. This is all you need as a basis for taking a simple random sample, which is then done by using the random-number generator function. To find a step-by-step description, search for "Excel simple random sampling" on YouTube, and various easy-to-follow tutorials will come up, for example "Randomizing a list of students in Excel" under www.youtube.com/watch?v=lajWM28JCHE.
The problem with simple random sampling is that you need a very large sample size in order to get a representative sample of the population. Furthermore, if you are interested in a certain subgroup of your population of interest (which, in the example used above, could be organic goat cheese processors), with simple random sampling you might only have very few or even none of those elements included in your sample. Thus, in most cases other random sampling procedures are a better choice.
D.3.4.1.2 Systematic sampling
Systematic sampling is only slightly different from simple random sampling. Basically, instead of selecting completely random elements for your sample, you choose every nth (e.g. every 4th or 7th) element. This procedure is useful if the list you use already has some internal order (e.g. your list is sorted according to farm size, with the smallest farm first and the largest farm last) and includes sufficient (>100) elements. In this case, systematic sampling will ensure that your sample will include both elements from the beginning of your list (i.e. with a small farm size) and elements from the end of your list (large farm size). It thus overcomes one problem of simple random sampling. A YouTube tutorial on systematic sampling is available under www.youtube.com/watch?v=vsGpTvlaABI ("Mod Function for Systematic Random Sampling Excel").
D.3.4.1.3 Stratified sampling
Sometimes it is helpful to divide your total population of interest into smaller groups who share some characteristics – this is what you do in stratified sampling. You can use one or more characteristics to create these different subgroups, which are called ‘strata’ (from latin for ‘layers’). Each individual stratum should be more homogenous in itself than is your total population of interest (i.e. people in one stratum should have more in common than all people from that population). The strata should not be overlapping, but should cover the whole population. In order to carry out stratified sampling, your sampling frame needs to include information on the characteristics according to which you divide your population into groups. If you do not have this information, you cannot apply stratified sampling.
- Example: How to conduct stratified sampling with Excel
First, you have to decide according to which characteristics you want to divide your population of interest and ensure that these are included in your list (i.e. farm type, farm size in hectares). You could then, for example, divide your population according to farm type, so that all dairy farms are in one subgroup, all cropping farms in another one and so on. The number of strata you create depends on the information you have (e.g. the farm type categories used in your list) and your aims. You could also use both farm type and farm size in hectares to build your strata, so that e.g. one stratum includes all goat farms <5 ha, another one all cropping farms < 5 ha, a third one all goat farms ≥ 5 and < 20 ha etc. Once all the elements in your population have been assigned to exactly one stratum (e.g. a 5 ha goat farm only appears in the stratum "goat farms ≥ 5 and < 20 ha", but not in the stratum "dairy farms < 5 ha"), you take a separate (i.e. simple random or systematic) sample from each of these strata. Click on www.youtube.com/watch?v=70qEBD3-88U to find a step-by-step tutorial on stratified sampling.
Stratified sampling allows for more accurate sample results than simple random and systematic sampling, the sampling error is reduced. However, it takes more time and is thus often more costly, which you need to weigh against the improved accuracy (the closeness of a measured value to the "true" value).
D.3.4.1.4 Cluster sampling
Another probabilty sampling method is cluster sampling. Similar to stratified sampling, in a first step the target population is divided into subgroups, which in this case are called clusters. However, while the strata in stratified sampling should in themselves be as homogenous as possible, clusters should be as heterogenous as possible. Cluster sampling is most often used for grouping according to geographic regions – thus, in each cluster you could have different farm types and farms of different sizes. From all the clusters you have created, only some randomly chosen ones (i.e. by simple random sampling) will be included in your sample. Depending on your cluster size (and your time and budget) you can then either collect data from all elements in the clusters, or you can do another sampling step to choose random elements from each individual cluster.
The problem with cluster sampling is that, in reality, clusters are often not as heterogenous as desired – for example, in some areas (and thus clusters) there might be many more goat farms than in the total country. Thus, you should only choose cluster sampling when you can assume that your clusters are at least as diverse as the total population.
D.3.4.2 Nonprobability sampling methods
In nonprobability sampling the sample selection is influenced by personal judgement and thus subjective. Hence, the sampling error cannot be assessed and the findings cannot be generalised for the whole population. If you use nonprobability sampling methods, you cannot claim statistical representativeness for your data. However, a big advantage of nonprobability sampling is that it is usually easier and cheaper to conduct than probability sampling. Frequently used nonprobability sampling methods are convenience, judgement, quota, and snowball sampling. Here, we will shortly introduce convenience sampling, but focus on quota sampling, as this is the most relevant option in the case of organic market data collection. The other nonprobability sampling methods should only be used for pre-tests or very small sampling sizes.
D.3.4.2.1 Convenience sampling
Convenience sampling is the most basic form of nonprobability sampling. The case where a person who conducts a survey simply decides who will participate in it; for example those people who are easiest to reach, is called convenience sampling. As you can imagine, such a convenience sample is normally very different from the total population of interest. To overcome this problem, you can choose a more advanced nonprobability sampling method, such as quota sampling.
D.3.4.2.2 Quota sampling
Quota sampling is quite similar to stratified sampling, as you also divide your total population into different (homogenous) subgroups. The idea behind quota sampling is that the share of members of the subgroups you include in your sample should reflect the proportions ‘in the real world’. For example, if you know that 30% of all goat farms in your country are located in mountainous areas, then 30% of the goat farms included in your sample you should also be farms from mountainous areas.
To prepare a quota sample, you need to know (or be able to estimate) the proportions of those characteristics which are relevant for you: For consumer research, such characteristics could be age, gender or income. A possible source could be national census data. Next, you have to decide how many interviews you are planning to conduct (i.e.100) and apply the proportions (quota) of each subgroup to your sample. With this, you set up a quota plan, which provides you with a detailed overview over the kind of people you will have to interview (see Table D.3-2 for a simple example on age and gender). When the quota for a certain subgroup is fulfilled, you stop collecting data from that group. This is a major distinction from stratified sampling, as the choice of the people being interviewed is not necessarily random, but influenced by the interviewer. Thus, the results can be biased, and no statistical error can be measured.
Table C.3-2: Example of a quota plan for data collection on the purchase of organic products
| Population of interest: Regular buyers of organic products (e.g. at least once a week) Total number of interviews to conduct: 100 Characteristics considered: Age and gender Quota (adopted from other studies on organic product consumption): Age: 50% <50 years, 50% ≥ 50 years Gender: ca. 65% women, 35% men | ||
| Number of people to interview in each group | Number of people already interviewed (stop when quota is fulfilled) | |
| Age < 50, female | 33 | IIIII IIIII IIIII IIIII IIII (29) |
| Age < 50, male | 17 | IIII (4) |
| Age ≥ 50, female | 33 | IIIII IIIII IIIII II (17) |
| Age ≥ 50, male | 17 | IIIII III (8) |
| Total | 100 | 58 |
- Explanation: During data collection, you register each participant’s age and gender. If you interviewed a 40 year old woman, you add one check mark in the row “Age < 50, female”; for other participants, you proceed accordingly. As you can see in the example, so far 58 of 100 people have been interviewed. The quota for women, age < 50, is almost fulfilled (only 4 women missing for the quota of 33). On the contrary, 13 more men, age < 50, still need to be interviewed to fulfil the quota (of 17) for this group. Thus, the interviewer has to approach more men in the continuation of the survey.
The following checklist summarises the questions you should ask yourself when taking a decision about which sampling procedure to use.
Checklist: Which sampling method should you use?
- Which sampling methods have been used in comparable market data studies?
- Do you need representative results? → If yes, you must use probability sampling
- Do you want to divide your population of interest into smaller units (e.g. into farms of different types and sizes, into farms from different areas)? → If yes, use quota sampling (for non-representative results), stratified or cluster sampling (for representative results)
D.3.5 Stage 5 of sampling: Determine the sample size
Along with the choice of your sampling method, you need to decide about your sample size. Generally, larger samples give a more accurate impression of the real distribution of certain characteristics in a population. However, in some cases you might prefer a smaller sample and focus on getting higher quality data, e.g. by employing less, but better trained and qualified interviewers. Your budget will also play a role in your sample size decision.
As you cannot statistically calculate your sample size in nonprobability sampling, you have to take the mentioned aspects into account and weigh them according to your specific case of organic market data collection. Secondary research and feedback from other researchers will help you in this case, too.
D.3.5.1 Sample size determination for probability sampling
You can only statistically calculate the sample size which is necessary to get representative results if you use probability sampling. Thus, statistical considerations play an important role and the following text introduces a number of statistical terms. One term you have already come across earlier in this chapter is the sampling error. The sampling error is relevant for the sizes of a sample as it decreases with increasing sample size.
- Example
A national census has shown that the average age (statistically expressed: the arithmetic mean of all individual people’s ages) in a country is 35 years. In a sample of 50 randomly selected people, the average age is 42 years, because by chance a greater number of older people were included. In this case, the sampling error is equivalent to 7 years (the difference between 35 – the ‘real’ average age of the total population – and 42, the age that has been measured with the sample). Now, the more people you include in your sample, the more closely the result will approach the 35 years obtained by the census – and the smaller the sampling error will be.
From the confidence interval you can draw conclusions on the accuracy of your results. The confidence interval defines a range of values (in the example above: age levels) of which we can be confident (but not sure) that they include a value measured by us.
- Example
If the average age of people from a certain country is 35, the confidence interval could range from 30 years to 40 years (30 and 40 being the confidence limits), from 33 to 37 years etc.. Please notice that, as the average age of 35 is the arithmetic mean of all values, it is just in the middle of the two confidence limits. Here you see how sampling error and confidence interval are connected: If you ask a few hundred people about their age (instead of only 50 as in the example above), it is much more likely that the average of that sample will lie between 33 and 37 years (and not be 42 years). Thus, the confidence interval decreases with sample size.
In publications, i.e. on market data, the confidence interval is usually presented together with the directly connected confidence level. Most often, a confidence level of 95% is used, which is normally expressed by the term ‘z’=1.96. This confidence level tells you that if you repeated a measurement 20 times, 19 times the results would fall into a certain confidence interval. The more confident you want to be about your results, the greater your sample has to be. In order to know which z-value corresponds to which confidence level, you can use a "z-table" which you can find in the annex of many textbooks or via entering "z-table AND confidence" in a search engine such as Google.
- Example
A study shows that 20% of all consumers in a certain country buy organic products more than once a week. The confidence interval given is 2.5%, the confidence level 95%. You can interpret this in such a way that, if you repeated the same survey, you can be 95% sure that between 17.5% (20% - 2.5%) and 22.5% (20% + 2.5%) of all consumers stated that they buy organic products more than once a week. If you want to be more confident (let’s say, that the result should be the same 39 out of 40 times), you need to increase your sample size.
If you want to calculate your sample size for probability sampling methods, you can basically choose from two major approaches: One is based on sample means and one on proportions (adapted from Shao & Zhou, 2007).
D.3.5.2 Determination of sample size based on a sample mean
You could apply this approach if you wanted to determine the average size of organic farms in your country. In the next example, we use data related to organic farm sizes in hectares. Obviously, not all farms are of the same size. If farm sizes vary greatly, we statistically talk about a large dispersion or variance. This dispersion is mostly expressed through the statistical term ‘standard deviation’ (the square root of the average of the squared differences of the mean). If the farm sizes are very heterogeneous (this is, the variance and thus the standard deviation are rather big), you need a bigger sample size. To decide which is the standard deviation to apply for the determination of your sample size, you can use information from earlier studies (thus, from secondary research), from personal experiences or from information by experts. Furthermore, you have to decide how accurate you want your results to be, so which sampling error (expressed by ‘E’, the standard error of the mean) you would accept. If accuracy is very important for you, you can only accept a very small sampling error.
The formula for the determination of sample size when estimating a sample mean is the following:
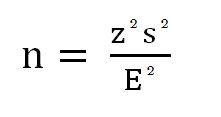
- Example of a survey on the size of organic farms
In our example we know from previous studies that the standard deviation (s) of organic farm size in a certain country is 35 ha. We have decided that we would accept a standard error of 5 ha and apply the standard level of confidence of 95%. The parameters given thus are:
Standard deviation (s) = 35 ha (value derived from a previous study)
Level of confidence (z) = 1.96 (95%-level of confidence)
Sampling error (E) = 5 ha (maximum sampling error of ± 5 ha is accepted)
As a result, we want to know how many organic farms we would need to include in a sample to get a reasonable result on their average size (expressed by ’n’).
If you fill in the parameters, the calculation is
- The outcome thus tells us that we need a sample size of 188 organic farms in order to get reasonable results.
D.3.5.3 Determination of sample size based on proportions
The second option for sample size determination for probability samples is based on proportions. The formula is the following:
- The result tells us that it is necessary to survey 140 farms that keep laying hens to achieve a reasonably accurate number for the percentage of organic farms that keep laying hens.
The checklist summarises the questions which are relevant for the determination of your sample size.
Checklist: How can you determine the sample size?
- Which sample sizes have been used in comparable market data studies?
- Have you used probability sampling? → If yes, you can calculate the sample size
- How accurate does your sample have to be? → For greater accuracy, increase the sampling size
- Do you have information about means or proportions?
- How large is your budget?