 This website was archived on January 11, 2020 and is no longer updated.
C4: Data processing, storage and analysis
C4.1 Inputting data
It is possible to enter data directly into the database, which is what FiBL and AMI do in many cases. We enter the data directly into the main table, but of course it is also possible to use forms/questionnaires for more comfortable data entry.
Again we recommend the use of look-up tables (see chapter 7) that enable standardized data entry and reduce the possibility of errors caused by spelling mistakes when inserting data.
For the OrganicDataNetwork, the possibility of automatic data entry into the MS Access database was programmed, based on the OrganicDataNetwork’s MS Excel questionnaire. This is extremely efficient. The original tool was programmed by fleXinfo (www.flexinfo.ch) for FiBL’s data collection on organic agriculture worldwide the tool was adapted for the purpose of the OrganicDataNetwork.
C4.2 Implementing quality checks
In the OrganicDataNetwork project, a number of quality checks/plausibility checks were developed.
The key checks identified were:
- Comparison between two years (for all indicators)
- Comparison between countries with similar farming conditions
- Organic production (share in %) < organic area (share in %)
- Organic yield < conventional yield
- Organic area < total area
- Imports < retail sales
Domestic organic consumption = organic production, sold as organic + organic imports - organic exports (modified)
For the quality checks of the OrganicDataNetwork, we used Pivot tables as a basic tool. We programmed a number of tables and used the "conditional formatting" function to highlight inconsistent data.
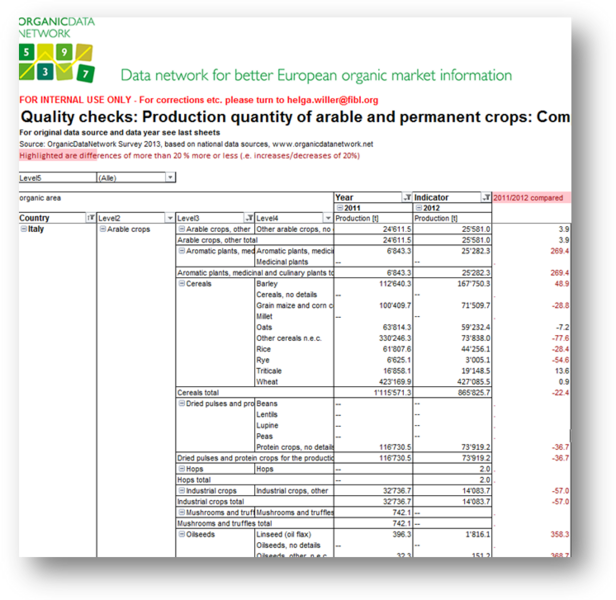
C4.2.1 Comparison between two years (for all indicators)
In the example below, we show the comparison of the organic production for the years 2011 and 2012. In the column on the right, we are highlighting 2012 data that are either 20 percent higher or lower than the 2011 data. If the differences are more than 20 percent or even higher, it might be a good idea to double check the data and find an explanation. We recommend doing this check for all indicators.
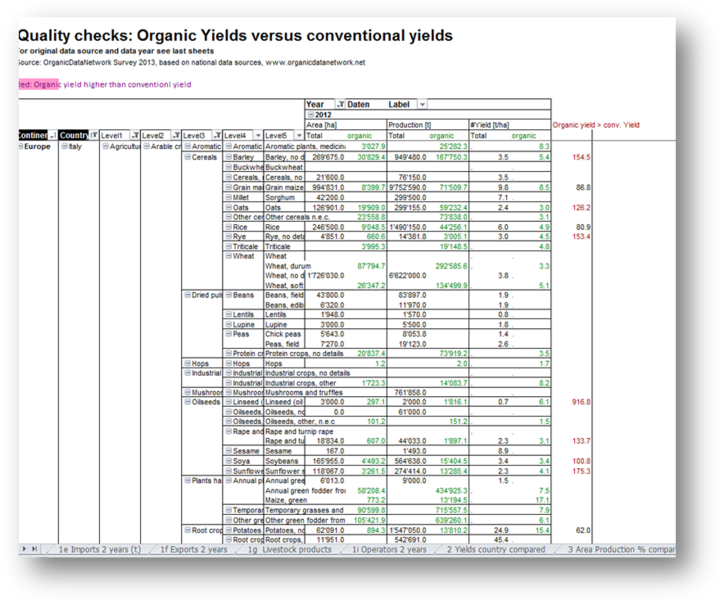
C4.2.2 Comparison of yields
It is possible to enter yields directly into the database for comparison, but it is also possible to calculate the yields automatically (metric tons per hectare) in the Pivot tables. The comparison of organic yields with conventional yields (e.g. based on FAO data) can provide interesting information. If the conventional/overall yield is lower than the organic yield, this could be a hint about a potential inconsistency, and it might be worth checking the data. Another interesting comparison is between the yield data and countries or regions with similar farming conditions.
When comparing the yields of different countries, you have to look in-depth into the data collection methods. Yields are mainly calculated from area data and production volumes from the fully converted land. Thus, for the yield calculation, the area data should only be the fully converted area. Also, there are countries that only count the production volumes on the market. For example, in France, there is data collection among the mills and feed producers to determine grain production. All the grain that is used directly, mainly for feed, is not taken into account, and, therefore, the yields seem to be lower than in the neighbouring countries where production is estimated with other methods.
C4.2.3 Comparison with the overall total
Another very important quality check is the comparison with the overall total for a crop or a product. Ideally, you will enter not only the organic data, but also the total/conventional data in your database in order to programme the corresponding Pivot table. Depending on the country/crop/product, one can assume that an organic share of more than 20 percent may be a hint of inconsistent data.
Furthermore, based on the assumption that organic yields are not higher than conventional yields, at least in the countries of the temperate climate zones, it can be assumed that the share of organic production should not be higher than that of the organic area.
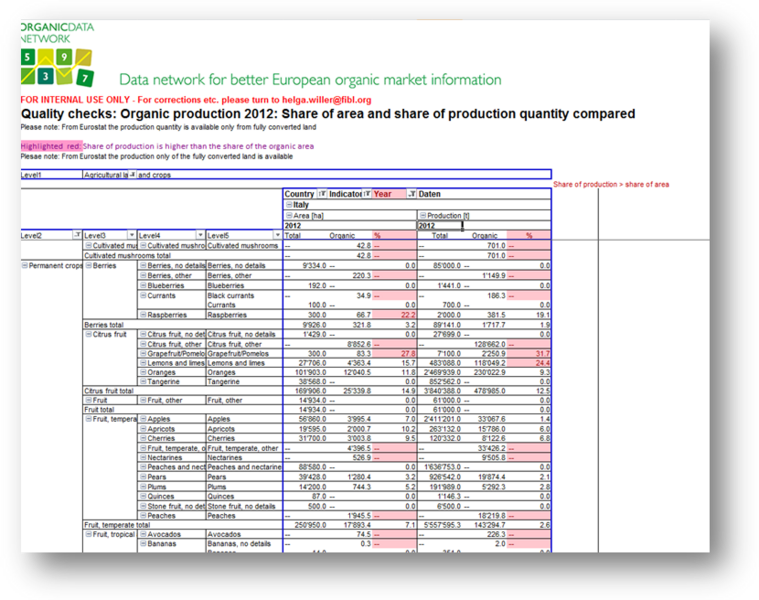
C4.2.4 Compare the share of the organic area with that of the organic production
The share of the organic area compared to the conventional area should be a bit higher overall than the share of organic production compared to the total production, as in general, yields are lower in organic agriculture. If the share of production is higher than the share of the area or, if the share of production is far lower than the share of the area, this might indicate inconsistent data.
For this check, it should be borne in mind that the production data are provided by Eurostat as the production from the fully converted area. In order to compare the share of production/area, the fully converted area should be used.
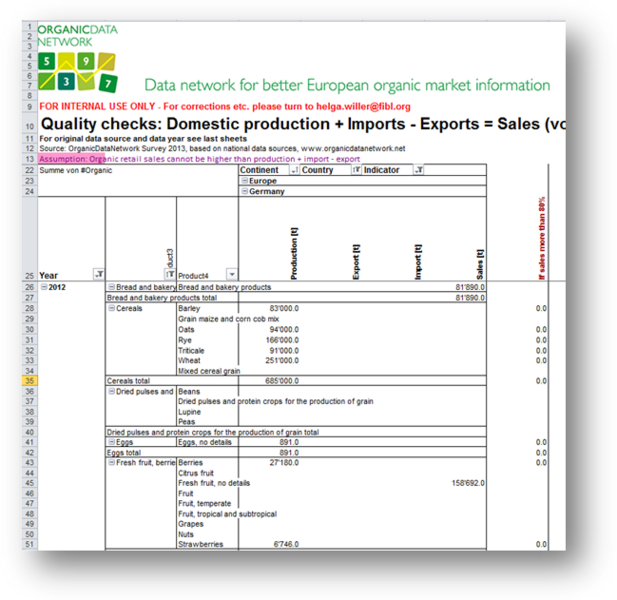
C4.2.5 Supply chain analysis
If the organic data are available for the full supply chain (organic production, retail sales, exports and imports) the following equation could be set up to find out inconsistencies: production + imports – exports – harvest and market losses = retail sales. There are only a very few countries that have data for such supply chain analysis, and then only for a few products.
Another simpler equation model could be that organic imports should not be higher than organic retail sales.
C4.3 Data analysis
The quality checks described above already give a lot of information about the data. Data that are conspicuous may be a hint for mistakes but also for interesting developments. For the data analysis, we recommend again the use of Pivot tables as well as that of graphs to highlight certain developments. In your data analysis you could:
- Analyse the (historical) development for the indicators by showing growth in absolute and relative terms;
- Compare, within one indicator, various countries/regions for one year;
- Compare, within one product, various indicators for one year;
- Compare, within one indicator, the organic performance compared to the overall total;
- Extrapolate trends of the organic sector.
Of course, it always depends on what you want to analyse or describe. The easiest data analysis and also quality check is to compare two different years or other periods.
For the comparison of different countries, it can be useful to compare data on the same indicators for different regions. For instance, in the OrganicDataNetwork, we have compared organic yields in neighbouring European countries. Yields are mainly calculated from area data and production data.
Comparing yields can be good for evaluating a country’s production. It is important to compare only yields calculated from converted areas. When comparing production and market volumes, you have to keep in mind that not all the production is sold on the market, but some remains on the farms for feeding animals or direct sales.
A really good possibility is to check various indicators (e.g. area, imports, retail sales) for one country and year. If there is data for most of the indicators, it is possible to make an equation model for certain products. In the OrganicDataNetwork, within the case studies in work package 6, we tried to show the challenges and barriers of that. The simplest equation model would be:
- Consumption = production minus exports plus imports.
This requires, of course, data on all these indicators.
When calculating this simple version of the equation model for carrots and also for milk in Germany, it became clear that either the production or consumption data were not accurate or that there are other facts to consider. Harvest losses and market losses can reduce volumes tremendously. There are also catering sales that have to be kept in mind. Nevertheless, an analysis along the supply chain always gives good hints about market structure and market development.
It is always useful to bring organic data into an overall context and thus, show organic shares and different developments. You can also compare organic shares for one product on the production and on the consumption side.