This website was archived on January 11, 2020 and is no longer updated.
C3.2 Forms & Questionnaires for different indicators and data collection methods, Sample
C3.2.1 Introduction
The questionnaire should be as easy as possible for the data providers and as comfortable as possible for the data collector. In the OrganicDataNetwork and also in FiBL´s global survey, it became apparent that the most practical way is to use Excel tables for the data collection. For easier data input, we suggest that you collect the data among your data suppliers with a standardized questionnaire. Depending on the type of data you are looking for, you will probably need different sheets; ideally all in one MS Excel table.
The OrganicDataNetwork’s questionnaire is very much based on the questionnaire used by FiBL for its global survey on organic agriculture, but it is currently being adapted to conform to the European classifications. It is available both in English and in Spanish.
C3.2.2 The questionnaire step by step
The OrganicDataNetwork’s MS Excel questionnaire, which can be found at http://www.organicdatanetwork.net/index.php?id=2649, is used as a model to show how a questionnaire can be built.
C3.2.2.1 About
It might be advisable to have an "about sheet" in which you explain the purpose of your data collection, the benefits for the data suppliers, and in where you provide your contact details.

C3.2.2.2 Information about the data supplier
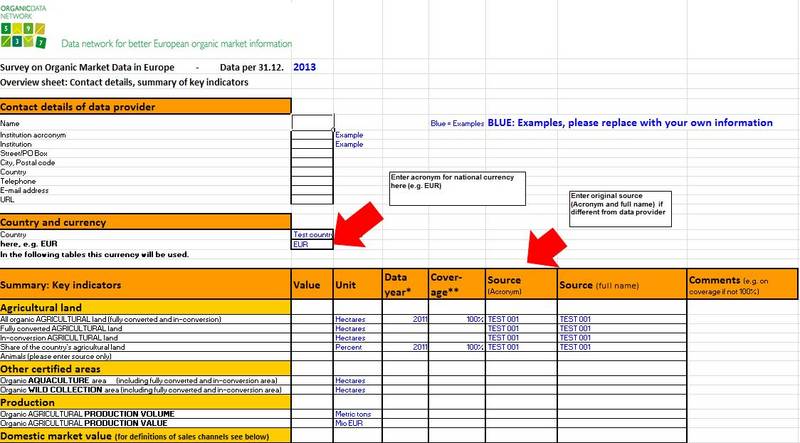
We recommend that you use the first sheet as a cover sheet with information on the data supplier. This would include contact information and information on the data source. The data suppliers are not the same as the data source in all cases, so you need to differentiate here (see Figure C.3-8). There might also be different sources for different types of data or different regions – all of this is covered by the questions on the cover page.
In addition to the information on the data supplier, in the OrganicDataNetwork questionnaire we also ask for the key indicators of the organic sector in a country.
C3.2.2.3 Data on operators
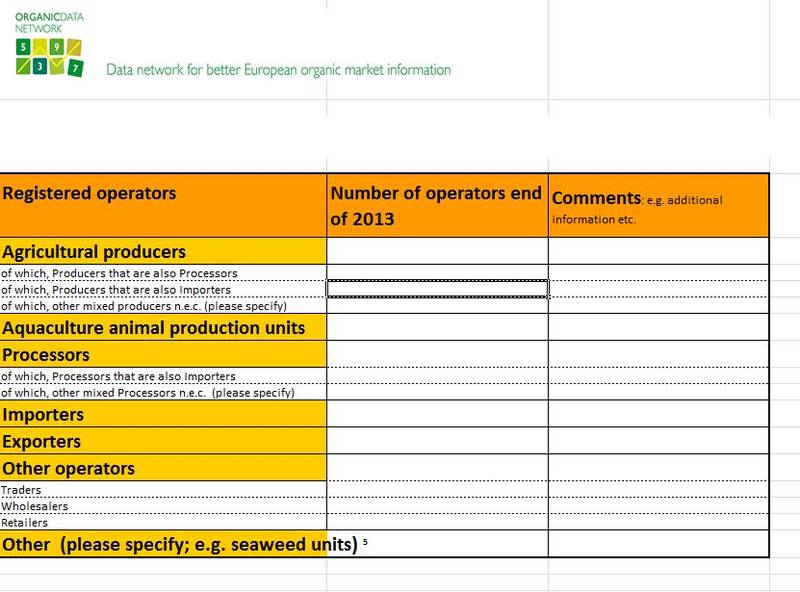
The number of organic operators should be collected in a separate sheet. Please find below the example of the OrganicDataNetwork questionnaire, which is based on the Eurostat questionnaire for organic operators (see Figure C.3-10). The Eurostat questionnaire also provides a definition of the various operator types.
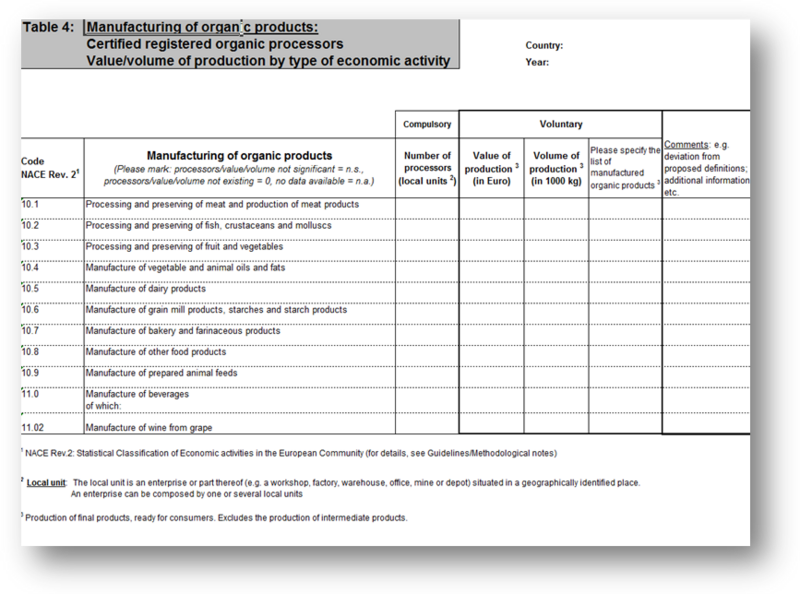
Eurostat has recently added a questionnaire for operators according to the NACE codes. NACE is the Statistical Classification of Economic Activities in the European Community. The NACE classification system can be found here: http://ec.europa.eu/eurostat/ramon/nomenclatures/index.cfm?TargetUrl=LST_NOM_DTL&StrNom=NACE_REV2&StrLanguageCode=EN&IntPcKey=&StrLayoutCode=HIERARCHIC
C3.2.2.4 Area and primary production
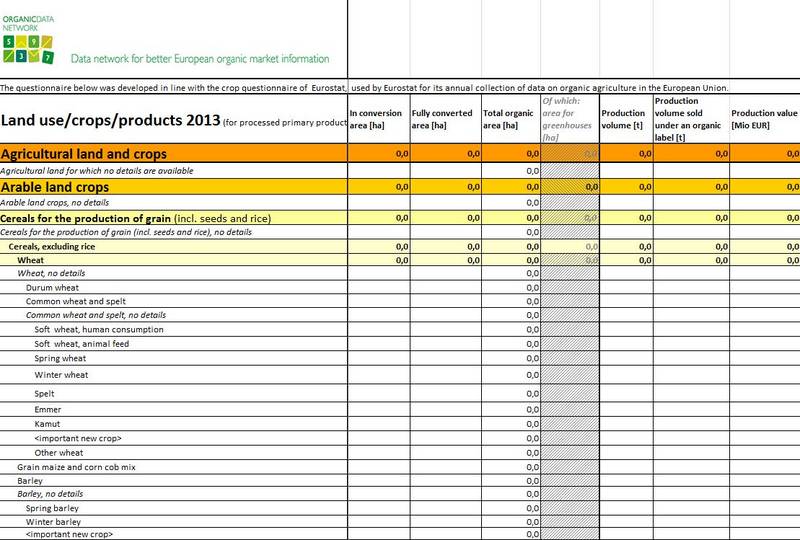
It is advisable to have a separate data sheet for the area and the production, and to use standards classification for this data. The example of the OrganicDataNetwork questionnaire (currently revised to fit the Eurostat classification) is shown in Figure C.3-12.
C3.2.2.5 Livestock numbers and production
Also, the OrganicDataNetwork questionnaire for livestock is based on the Eurostat questionnaire, "Data collection on organic farming statistics - Final Harmonised Questionnaire". When collecting data on livestock numbers, you have to define clearly whether you collect numbers on average stocks per year, livestock places, or slaughters per year. This might differ essentially, especially for pigs and poultry. Eurostat usually collects data on average stocks per year or on stocks on one or even two days in a year. However, there are sometimes inconsistencies, and member states provide numbers other than the required data.
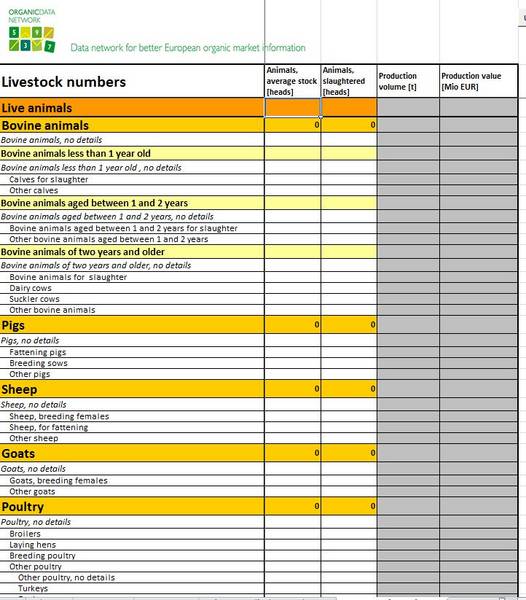
In the OrganicDataNetwork, we also tried to get consistent data on average stocks, but sometimes got other figures from the countries and calculated the average stocks with a factor from the number of slaughters or from the number of places.
For clear definitions, we recommend defining different indicators "Animals average stocks [heads]", "Animals [places]" and "Animals [slaughters]" to make it clear. The same clear definition is needed when collecting data on meat, milk or egg production. For meat, you have to define whether collecting carcase weights or meat sales volumes. For milk, it also has to be defined whether you collect raw milk deliveries (to dairies) or drinking milk sales volumes. The agricultural production (carcase weight and raw milk) is usually much higher than sales volumes in the shops. Often there exists only one of the data, but you need to know which one it is for cross-checking and comparing it with other data.
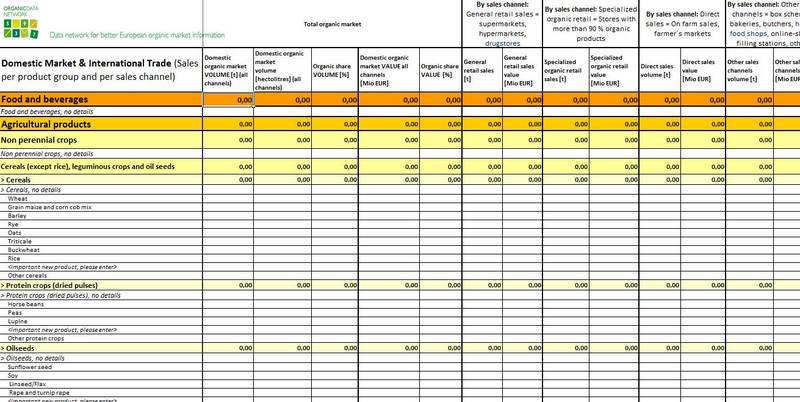
C3.2.2.6 Market and international trade data
For market and international trade data, the OrganicDataNetwork has developed a questionnaire built on a classification they developed that is based on international classifications as well as on those used by market research companies like Nielsen and GfK. This classification is currently adapted to fit with Eurostat’s CPA codes.
Data on the following indicators were collected for the OrganicDataNetwork:
- Total retail sales by product in the local currency (In the database, both the value in the local currency as well as in Euros is stored, calculated with the annual exchange rate of the European Central Bank.)
- Total retail sales by product in metric tons
- Organic share of the retail sales (volume and value) by product
- Organic retail sales (in volume and value) by product and by marketing channel (in local currency/Euros and in mt)
- Exports and imports in volume and value by product and by marketing channel (in local currency/Euros and in mt)