 This website was archived on January 11, 2020 and is no longer updated.
C3.1 Building a database: Key elements and recommended database structure; sample database
C3.1.1 Introduction
In the following chapters we explain how a database for organic market data could be structured and what tools could be used for quality checks and data analysis. As an example we are using the example of the database of the OrganicDataNetwork, but of course there may be other ways of storing and processing data. However, for easy data exchange among the partners of the OrganicDataNetwork and future partners in the area of market data collection, we recommend that similar databases are built so that data can easily be exchanged or merged in a European organic market database.
In the following we explain how basic data on the organic sector and market have been collected in the framework of the OrganicDataNetwork project. We assume that some of the techniques can be of use to other collectors of organic market data as well. However, we advise our readers that they adapt the information given in the following chapters to their own needs.
If you need help, you can always contact helga.willer(at)fibl.org.
C3.1.2 Basic considerations
Before you start the work on a database, you should ask yourself the following questions (see also part C 2 of the ORMACODE):
- What data do I want to collect? (i.e. on what indicators - like area, imports, exports, sales volumes, sales values, consumer prices, or producer prices), in what product detail, for what region, for what time period?
- How do I want to extract the data?
- What will be the final form of dissemination?
- What is the purpose of the data collection: Publication, closed user groups, or own needs?
C3.1.3 Basic database structure
For data collection, it is important that you store data in a database. We recommend that you use one database for all data, even if you collect data for different types/indicators. This will make the comparison of data, e.g., for quality checks, a lot easier. As a first step, a simple MS Excel sheet might be sufficient, but in the long-run a proper database, for instance, based on MS Access, is needed.
- When you set up your database or data sheet, please make sure all information is organised in columns with only one value per row. We strongly recommend not using cross tables for data collection, only for analysis. For an example of a cross, table see, Table 2.
- For organic market data we recommend the following basic column structure, be it in MS Excel or MS Access.
- ID of dataset
- Date dataset was inserted
- Date dataset was modified
- Country or region ( if you collect the data for a number of countries or if you have a regional breakdown of your data)
- Data source
- Year/month/week
- Crop/product
- Indicator (hectares, tonnes, sales value etc.)
- Label (organic, total, other)
- Value
- Remark
Below is an extract from the OrganicDataNetwork database (Table C.3-1), which shows the data related to potatoes. Further down the information in the various columns is explained. A detailed description of the contents of the columns can be found in chapter 1.1.4.
Table C.3-1: Example: Potatoes and potato products from Germany (2012): Extract from the OrganicDataNetwork database
| modified | Id | Link to database | Year | CPA-Product0 | CPA-Product1 | CPA-Product2 | CPA-Product3 | CPA-Product5 | Indicator | Label | #Value | Value |
|---|---|---|---|---|---|---|---|---|---|---|---|---|
| 03.04.2013 | 770722 | AMI f013 | 2012 | Germany | Products of agriculture, forestry and fishing | Products of agriculture, hunting, related services | Non-perennial crops | Vegetables and melons, roots and tubers | Potatoes, no details | Sales [t] | organic | 79'240.00 |
| 18.09.2013 | 654130 | AMI f018 | 2012 | Germany | Products of agriculture, forestry and fishing | Products of agriculture, hunting, related services | Non-perennial crops | Vegetables and melons, roots and tubers | Potatoes, no details | Area [ha] | organic | 8'300.00 |
| 21.09.2013 | 600188 | AMI f018 | 2012 | Germany | Products of agriculture, forestry and fishing | Products of agriculture, hunting, related services | Non-perennial crops | Vegetables and melons, roots and tubers | Potatoes, no details | Sales [Mio €] | Total | 977.10 |
| 20.09.2013 | 654920 | AMI f018 | 2012 | Germany | Products of agriculture, forestry and fishing | Products of agriculture, hunting, related services | Non-perennial crops | Vegetables and melons, roots and tubers | Potatoes, no details | Sales [Mio €] | organic | 93.72 |
| 20.09.2013 | 655012 | AMI f014 | 2012 | Germany | Products of agriculture, forestry and fishing | Products of agriculture, hunting, related services | Non-perennial crops | Vegetables and melons, roots and tubers | Potatoes, no details | Sales [Mio €]: Share [%] | organic | 9.59 |
We strongly recommend that you do not build cross-tables to store the data (Table C.3-2), as this will make data analysis, export and import very inflexible. Do not use columns for individual indicators (or years, countries or regions).
Cross tables are, however, very useful for data analysis, for instance Pivot tables and and for data presentation.
Table C.3-2: Example of a cross table. Do not use for data storage, only for data analysis
| Area [ha] | Retail sales [Mio €] | Retail sales [mt] | Production [Mio €] | |
|---|---|---|---|---|
| Potatoes, no details | 8'300.0 | 93.7 | 79'240.0 | 54.6 |
| Processed/preserved potatoes | 1.8 |

C3.1.4 The database structure by column
ID
Each data set needs an ID. Usually MS Access generates the ID automatically. To trace a certain dataset it is useful to have a unique identifier for each dataset.
Date inserted
This is the date on which a dataset was inserted. Usually, it is generated automatically in the database.
Date modified
If you modify a dataset, it is useful if you document the change. Ideally, you also use the remark field to explain why the change was done. Another option would be to delete a dataset and make a new one with the current date or mark a dataset as “changed” and add a new dataset. Thus, changes can be made visible.
Data source
Here you can briefly specify the data source. However, it is often not enough to simply enter the name of the source. In order to trace back the original source, which in the daily work with a database is often needed, we recommend that you document the source with a lot more detail. This should contain the name of data collector, the exact name of the publication/source including the link to the publication if available online. For this, you should use a so-called "look-up table" with further specifications as well as a folder in your computer where you store the documents with the original data.
Year/month/week
This field is needed to enter the calendar or business year of the data. Most organic data collection systems use the calendar year (i.e., January to December) and not the business year. The business year is mainly used for the production of plant products and their sales values and volumes. Of course you can use the column "year" also for the business year. However, if you have different data types with different types of years, you might need to insert a separate column "business year". For other data types such as exports, imports, consumer prices, or producer prices you might also use monthly or even weekly data. In those cases the column "time" should be defined in a look-up table with a predefined list.
Data year
Especially if you are interested in showing developments over years, it might be advisable to carry on data from the previous year. If, for example, you have no current figure on the area of potatoes, an old figure would probably be more correct than no figure at all. But it needs to be documented from which year this old figure is. For this purpose, this column can be used.
Country
If your data has a regional dimension, this column should be used to indicate the country, region, etc. In order to avoid typing errors and make sure all data can be extracted correctly, we recommend that you use a "look-up table" with a predefined country/regions list. Spelling errors are thus not possible and would not lead to mistakes in correlation to other data sets.
Crop/product
Use this column to enter the crop/product. If you want to not only store the crop or product, but also store information on the crop/product groups, you either need to create several columns in the main table or use the look-up tables for classification (see chapter 1.5) .
For example, in the case of potatoes, you would specify that a potato is a root crop, that a root crop is an arable crop (as opposed to permanent crops), that arable crops are part of agricultural land (as opposed to wild collection) and that the Eurostat code for potatoes is C_031.
A look-up table for crops and products is advisable:
- to make sure that no spelling errors can happen that would lead to mistakes in correlating data sets.
- to add extra information to the crop/product and to place it within a whole hierarchy including product/crop codes. This way, one column will be sufficient in the main table.
See the chapter on classification and nomenclature for further details (chapter 1.6).
Indicator
It is important that you have a clear idea of the indicators that you need for your data collection for instance area, imports etc. The OrganicDataNetwork uses one column, both for the indicator and the unit ("Area [ha]", "Area [acres]"). It would also be possible to have separate columns, one for the indicator and one for the unit, which might allow more flexibility.
Again, in order to make sure that data input is standardized, we recommend a "look-up table" for the indicators.
The indicators used in the OrganicDataNetwork project (focusing on area, livestock, production, operators, retail sales, imports, and exports) are listed in the chapter on the indicator look-up table.
Label
In this column you can specify if a figure relates to organic (label "organic") or to overall agriculture (label "total"). This is important if you want to compare your organic data with your country’s overall totals. You can also use these columns for further labels like Fairtrade.
Value
The actual number is entered into this columns.
Further possible columns
Further possible columns could be on marketing channels, export and import destinations, for the original crop name, other hierarchies or codes used or the method used for the data collection.
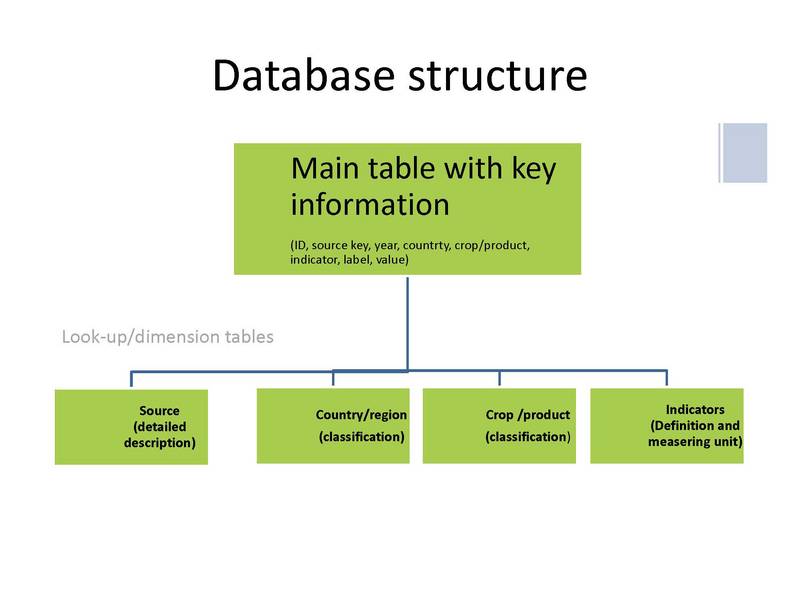
C3.1.5 Look-up tables (Dimension tables)
Depending on how you build your database, you can either store all information in one table (Table C.3-1), or you can store only the key information in the main table, which you then supplement with look-up tables that are linked to the main data table. Look-up tables serve several functions.
They can:
- Standardize repeated information;
- Supply additional information;
- Help to keep the main table neat and compact;
- Connect various data sets;
- Show data according to different classifications.
Table 3 is an example of a table that has all relevant information in one sheet. The coloured bars show what information could be transferred into a look-up table. Of course, in all cases, you need a unique key to connect the correct information with the data in the database.
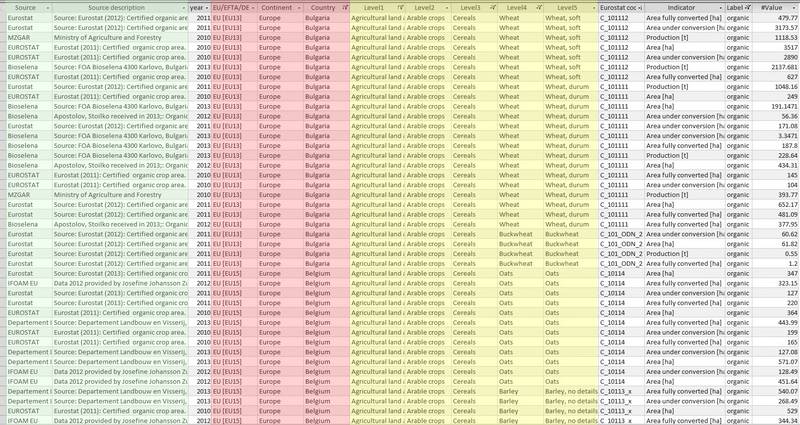
- Green columns: Additional source information could be potentially clustered (and expanded, e.g. with links to original documents) in a look-up table labelled "Source".
- Red columns: Regional, additional information could potentially be stored in a look-up table labelled "Region".
- Yellow columns: Additional crop information could be potentially stored in a look-up table labelled "Crops".
- Indicators: the look-up table for indicators should be included in order to ensure consistent writing.
Unless you want to store all your data in one main table (as shown in Table C.3-1), we recommend to connecting the main table in the design view via the look-up table and row source (see figure C.3-1) with the following look-up tables, with additional information.
- Look-up table "Data source"
- Look-up table "Country or region"
- Look-up table "Crop production"
- Look-up table "Indicator"
- Look-up table "Time" if you have more details than years
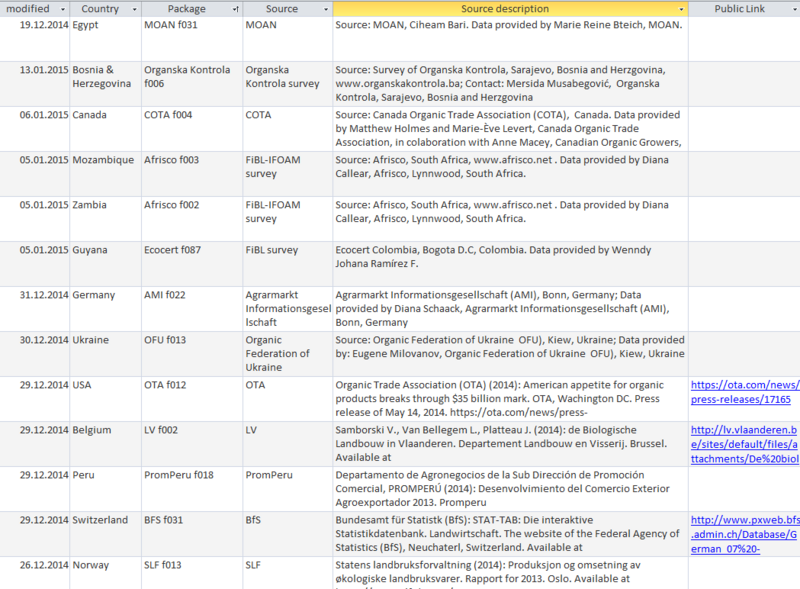
C3.1.5.1 Look-up Table "Data source"
The look-up table "Data source" should be connected to the column "Source" in the main data table. Data is usually delivered in packages at different times from the same source. Therefore, it is important to name not only the source but also the exact name and date of publication. The table source should include the following information/columns:
- The ID for the dataset in question
- The date a dataset was entered
- The date a dataset was modified
- The country or region (if relevant)
- The "package," i.e., the identifier for the exact data source number (e.g., AMI 001 for data that AMI provided for the organic area for the year 2010)
- The author or contact person if deemed relevant
- The acronym of the source (e.g., "AMI" instead of "Agrarmarkt Informations-Gesellschaft")
- The correct description of the source
(e.g., AMI [2014]: Data on organic agricultural land. AMI; Bonn, Germany. Data provided by Diana Schaack, AMI, Bonn, Germany, e-mail of May 2, 2014).
If it is a published source, then quote by general citation standards; the same applies to web products.
E.g., Eurostat (2014) Certified organic crop area by crops products [food_in_porg1]. Last update 03.03.14; Extracted on 02.05.14. Source of data: Eurostat. The Eurostat website, Eurostat Luxembourg. Data available at http://epp.eurostat.ec.europa.eu/portal/page/portal/statistics/search_database - Internal link; i.e. link to the full document of the data on your own server including the mail with which it was sent
- Link to the public version of data
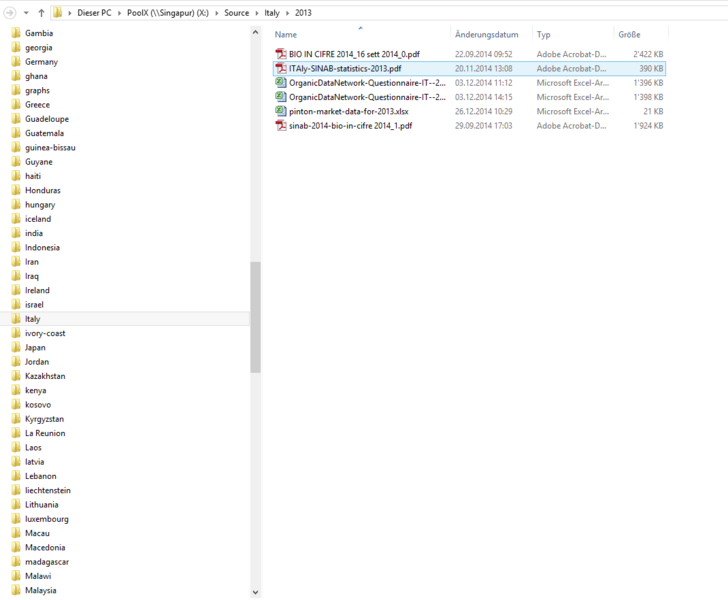
We strongly recommend that you save all original documents (by year) that you use as data sources. This includes the e-mails with which data was originally sent (if applicable). Ideally, a link to these documents should be made in the database.
C3.1.5.2 Look-up table "Country or region"
We recommend that you install a country/region look-up table, again, in order to avoid spelling errors and in order to allocate regions or countries to a special group (e.g., EU countries; all French departments to a region).
The main table would then only contain the information "Haut-Rhin," but the look-up table would specify that this is part of Alsace, that Alsace is part of France, that France is part of the EU, and that the EU belongs to Europe. This way, you will be able to extract the data not only at the department level, but also at the regional level, etc. Of course, it depends on your needs.
Table C.3-3: Example of what a regional dimension table could look like (please adapt to your own needs)
| Departement/Provincia, Kanton | Region | Country | Country group | Continent |
|---|---|---|---|---|
| Haut Rhin | Alsace | France | EU | Europe |
| Aargau | Nordwestschweiz | Switzerland | EFTA | Europe |
| Modena | Emilia-Romagna | Italy | EU | Europe |
C3.1.5.3 Look-up table "Indicator"
It is also important that you have fixed rules/spellings for your indicators. In the OrganicDataNetwork, we use the indicators as shown in the following table.
Table C.3-4: Indicators uses for the OrganicDataNetwork project database
| Indicator | Explanation |
|---|---|
| Animals [heads] | Number (heads of animals), average stock |
| Area [ha] | Area, both in conversion and fully converted |
| Area fully converted [ha] | Fully converted areas by crop etc. |
| Area under conversion [ha] | Conversion area by crop etc. |
| Beehives [no] | Number of beehives |
| Export [Mio €] | Export value by individual crops, products in million euros |
| Export [Mio €], share [%] | Share of export value by product of total exports for hat products |
| Export [Mio LOC] | Exports by individual products in local currency |
| Export [t] | Export volume (in metric tons) by individual products |
| Import [Mio €] | Import value in million euros by product |
| Import [Mio €], share [%] | Share of import value by product of total imports for that product |
| Import [Mio LOC] | Imports by product in million local currency |
| Import [t] | Import volume (in metric tons) by product |
| Import [t], share [%] | Share of import volume (metric tons) by crop of total imports |
| Operators, exporters | The natural or legal person within the Community who exports to a third country organic products with a view to the subsequent marketing (Eurostat definitions) |
| Operators, importers | The natural or legal person within the Community who presents a consignment for release for free circulation into the Community, either in person, or through a representative (Eurostat definition) |
| Operators, processors | Operator who preserves and/or processes organic agricultural products (incl. Slaughtering and butchering) and aquaculture products; Packaging and labelling as organic is also considered as processing (Eurostat definition) |
| Operators, producers | Production unit operated under a single management for the purpose of producing agricultural product (Eurostat definition) |
| Production [Mio €] | Production value by crop/product |
| Production [Mio LOC] | Production value in million local currency by crop/product |
| Production [t] | Production volume by crop/product |
| Production [t]: Share [%] | Share of the production volume of the total production |
| Retail sales [Mio LOC]: Share [%] | Share of organic retail sales of a product |
| Sales [LOC/person] | Domestic retail sales per person by product in million local currency |
| Sales [Mio €] | Domestic sales by product in million euros |
| Sales [Mio €]: Share [%] | Share of total retail sales value by product |
| Sales [Mio LOC] | Domestic retail sales by product in million local currency |
| Sales [t] | Domestic retail sales volume in tons by products |
| Sales [t]: Share [%] | Share of domestic retail sales volume (metric tons) by product |
| Sales, growth 1 year [%] | Growth of retail sales by product in one year |
In the OrganicDataNetwork database we merge the unit and indicator, but in certain cases it may be a good idea to separate these so that you have more flexibility and do not end up with a very long list of indicators. This could look as shown below.
Table C.3-5: Example: Indicators
| Combined indicator | Indicator | Unit |
|---|---|---|
| Area [ha] | Area | [ha] |
| Area [m2] | Area | [m2] |
| Imports [mt] | Imports | [mt] |
| Imports [kg] | Imports | [kg] |
C3.1.5.4 Look-up table "Crops/products"
Also, the products should be in a look-up table. For this, you will not only need to think of how to spell things and what terms to use, but also, more than with the other look-up tables, on how to group them.
You should specify, for instance, that a cos lettuce is a lettuce, that lettuce is a leaf vegetable, that leaf vegetables are vegetables, that vegetables are arable crops, and that arable crops are part of the agricultural land. This will allow you to extract or filter the data not only at the lowest level but also at a group level (all arable crops together, all vegetables or cereals). This also applies to products.
Table C.3-6: Example for structuring crops or products hierarchically
| First level | 2nd level | 3rd level | 4th level | 5th level | 6th level | Code Eurostat |
|---|---|---|---|---|---|---|
| Agricultural land | Permanent crops | Tropical fruit | Bananas | Bananas | Bananas | C2254 |
| Agricultural land | Arable crops | Cereals | Barley | Spring barley | Spring barley | C1164 |
| Manufactured products | Food products | Processed fruit and vegetables | Processed fruit | Fruit juices | Apple juice | C10.32 |
| Manufactured products | Food products | Grain mill products, starches and starch products | Grain mill products | Cereal and vegetable flour; mixes thereof | Rye flour | C10.61 |
When grouping/classifying crops and products we recommend that you use your national system if one is available or an international classification. It is very tempting to "invent" a classification of one’s own, but for comparisons with, for example, the total datasets in your country or for international comparisons, it is more useful to use the international classifications. For the long-term building of a common European market database, we recommend that you use the classification of the OrganicDataNetwork which is based on a Eurostat classification.
C3.1.5.5 Classifications and nomenclature
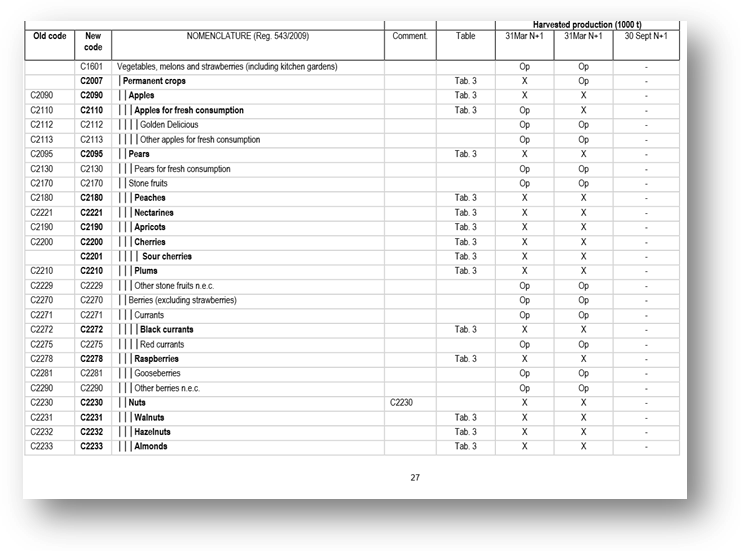
For the OrganicDataNetwork, we will be using two official classifications: one for land area/crops and one for products. These official classifications, however, will need to be/have been adapted and expanded to make them fit to the needs of the OrganicDataNetwork.
- For organic agricultural land and crops: Eurostat Handbook for Annual Crop Statistics (Regulation 543/2009) (Revision 2013 – Presented in the WPM on 12 and 13 March 2013; finalised in July 2013 (still to be adapted for the OrganicDataNetwork). Available at http://epp.eurostat.ec.europa.eu/cache/ITY_SDDS/Annexes/apro_cpp_esms_an2.pdf
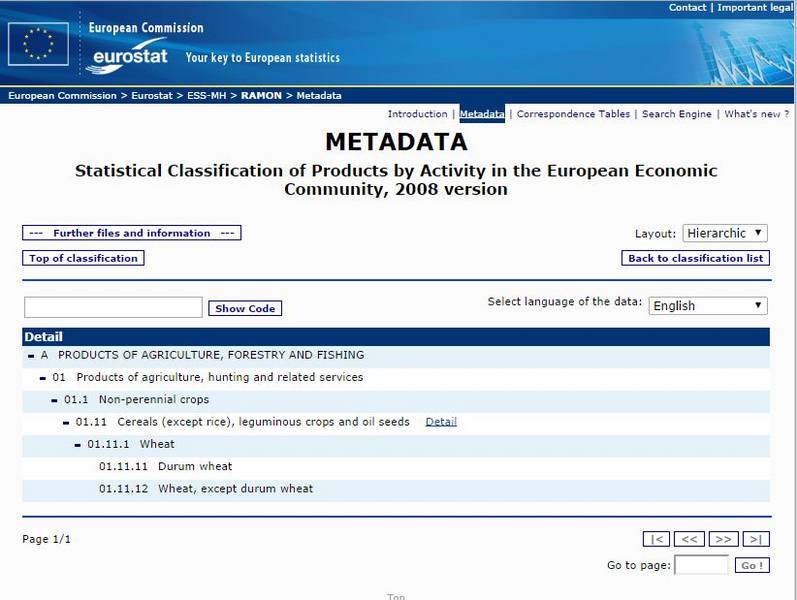
- For products: Eurostat (2008): Statistical Classification of Economic Activities in the European Community, Rev. 2 (2008) (CPA 2008). Eurostat, Luxembourg (already adapted for OrganicDataNetwork). Available at http://ec.europa.eu/eurostat/ramon/nomenclatures/index.cfm?TargetUrl=LST_NOM_DTL&StrNom=CPA_2008&StrLanguageCode=EN&IntPcKey=&StrLayoutCode=HIERARCHIC
For the crops, a questionnaire very similar to the one from Eurostat, used for its organic data collection, was used; however, with some additions (e.g., breakdown of protein crops-, or more details for tropical and subtropical fruit). For livestock, the questionnaire from Eurostat was used, but it does not cover all aspects (e.g., differentiation of animals slaughtered vs. places).
For the product data (production, retail sales, exports, and imports), the CPA product classification has already been included into the OrganicDataNetwork database, and the data collected in the framework of the OrganicDataNetwork data can be extracted according to this Eurostat classification.

C3.1.6 Extracting the data
C3.1.6.1 Simple data extract of the database
If you have all data in one MS Excel sheet or in one table in an MS Access database and no hierarchies included, then it is possible to extract the basic data (e.g., for one year or one crop) via filters in MS Excel or MS Access.
Table C.3-7: Example: Filtered organic area data for permanent crops in Denmark 2012 in the OrganicDataNetwork database
| Country | Crop level2 | Cropevel3 | Crop level4 | Indicator | Label | Value |
|---|---|---|---|---|---|---|
| Denmark | Permanent crops | Berries | Berries, no details/n.e.c. | Area [ha] | organic | 73.00 |
| Denmark | Permanent crops | Fruit, temperate | Apples | Area [ha] | organic | 302.00 |
| Denmark | Permanent crops | Fruit, temperate | Cherries | Area [ha] | organic | 8.00 |
| Denmark | Permanent crops | Fruit, temperate | Pears | Area [ha] | organic | 20.00 |
| Denmark | Permanent crops | Fruit, temperate | Plums | Area [ha] | organic | 5.00 |
| Denmark | Permanent crops | Grapes | Grapes, no details | Area [ha] | organic | 12.00 |
| Denmark | Permanent crops | Nuts | Nuts, no details | Area [ha] | organic | 7.00 |
| Denmark | Permanent crops | Permanent crops, other | Other permanent crops, no details | Area [ha] | organic | 76.00 |
C3.1.7 Using pivot tables
If you need to make sums or subtotals, then we recommend the use of Pivot tables. A basic introduction to Pivot tables is available in Wikipedia at https://en.wikipedia.org/wiki/Pivot_table. When using Pivot tables you need to consider that Pivot sums up everything! For example, when entering data for wheat, rye, and all the other cereal crops, you must not enter data for cereals total. Then you would double count cereals areas. Another possibility is using another indicator for cross checking and controlling. In the OrganicDataNetwork these indicators are called "area, all [ha]" or "sales volumes, all [t]".
Table C.3-8: Organic area data for Albania 2012 shown as Pivot table with subtotals
| Country | Level2 | Level3 | Level4 | Area [ha] |
|---|---|---|---|---|
| Denmark total | 503 | |||
| Denmark | Permanent crops | Berries | Berries, no details/n.e.c. | 73 |
| Berries total | 73 | |||
| Fruit, temperate | Apples | 302 | ||
| Cherries | 8 | |||
| Pears | 20 | |||
| Plums | 5 | |||
| Fruit, temperate total | 335 | |||
| Grapes | Grapes, no details | 12 | ||
| Grapes total | 12 | |||
| Nuts | Nuts, no details | 7 | ||
| Nuts total | 7 | |||
| Permanent crops, other | Other permanent crops, no details | 76 | ||
| Permanent crops, other total | 76 | |||
| Permanent crops total | 503 |
You can simply copy the information from the database into an Excel sheet and then analyse these data via the pivot function or make sure that the Pivot table uses the data directly from the database via linking the Excel table to the Access main table or to an adapted query in the database. The advantage of linking the Excel table is the easy way of updating.
Once the Pivot table is set up, you can analyse the data from the database in a flexible way.
C3.1.7.1 Using queries over several tables or to select certain data
The next question is how you will extract the data from the database. If you do not have all the necessary data in the main sheet, you might need to extract the additional information stored in the look-up tables as well. In this case, you need queries in order to extract the full data, i.e., the data from the main table combined with those from the look-up tables. You could then, for instance, create a query for organic area and production data by linking your main table with your look-up table "Crops/products".
More on writing queries is available at office.microsoft.com/en-us/access-help/microsoft-access-for-beginners-part-iii-writing-the-queries-HA010247313.aspx. If you use Pivot tables for data analysis, you should, when creating them, link each Pivot table to the query in question and not to the main table. With those queries, you can also pre-filter your data for not having the whole set of data in the Pivot-table but only data you want to analyse.