 This website was archived on January 11, 2020 and is no longer updated.
D.4 Step 4: Check for potential survey errors
Introduction
According to statistics, the greater the sample size, the more accurate the results of the sample will be. Before we have mentioned the sampling error, which is a kind of ‘random error’ because it is unavoidable and does not bias the results. The larger your sample is, the smaller is the random error will be. However, especially due to budget and time restrictions, sometimes it will only be possible to take a smaller sample.
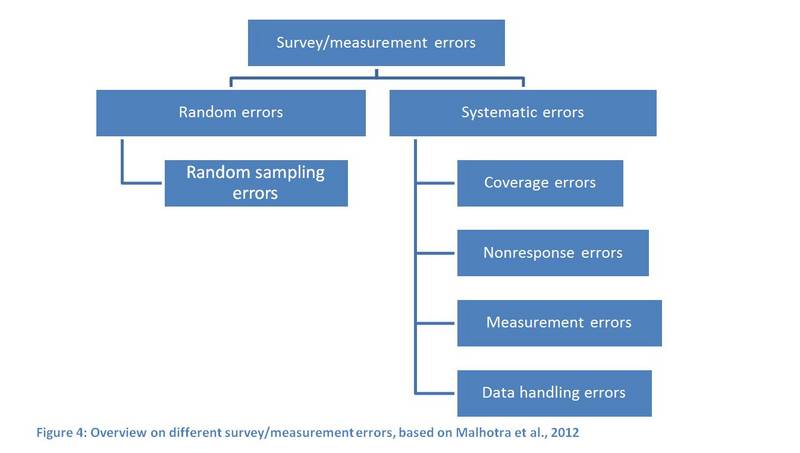
In any case, you should try to avoid so-called systematic errors (see Figure D.4-1) which, in contrast to random errors, lead to biased results. Systematic errors can be avoided by a thorough planning of all steps of your survey procedure. While coverage errors and nonresponse errors are mainly relevant during the sampling process, nonresponse errors as well as measurement errors can have a great influence during data collection. Data handling errors are mainly an issue during data collection and data analysis. Both random and systematic errors reduce the accuracy of resulting data. In the following, the different types of errors and ways to avoid or reduce them are introduced.
D.4.1 Random errors
Random errors are unavoidable. They occur due to the heterogeneity among the elements in your population of interest and because of differences in circumstances. These differences usually compensate for each other, but they increase the variance. Random errors can be calculated statistically.
Random sampling errors (often only called ‘sampling errors’) occur because the whole population is not investigated, but only a part of it. As they strongly depend on sample size, they can be controlled by the use of large enough samples. The sampling error is generally described as the standard error of a mean.
- Example for the calculation of a (random) sampling error
For this calculation, we refer back to the example of organic farm sizes used above. There, we had predetermined the sampling error (E) we were willing to accept (±5 ha); the standard deviation (s) was 35 ha and the level of confidence 1.96. The result has been a necessary sample size of 188 farms.
With the following formula, you can check this result and calculate the random error of the sample size. The formula of calculating random errors is:
- In the formula, z (your confidence level) is multiplied by the quotient of the standard deviation (s) and the root of n (number of units). The calculation for the sampling error thus is:
- The result confirms that, for a sample size of 188 farms and a confidence level of 1.96, you have to accept a sampling error of ± 5 ha. Now if you increase the sample size, the sampling error decreases: For a sample size of 400 farms, you only have to accept a sampling error of ± 3 ha.
D.4.2 Systematic errors
Systematic errors, as opposed to random errors, are caused by systematic mistakes and can appear throughout the whole collection process. Systematic errors lead to biased results.
- Example
Your aim is to interview 30 goat farms in Italy. However, you want to save time and travel costs and thus decide you will only interview goat farms in Sicily. In this case, the results will systematically differ from the results you would have obtained if you had really visited goat farms in the whole country.
Coverage errors occur if the population of interest (those elements we want to study) does not match the sampling frame (those elements we actually approach with our survey). Hence, they result from a wrongly defined sampling frame. When there are fewer elements on your list than there should be, this is called undercoverage. Overcoverage can occur when you have more elements on your list than are necessary.
- Example
Imagine your aim is to create a sampling frame that includes all organic farmers in your country. If you cannot access the addresses of organic farmers from a certain district, or from organic farmers’ associations as they do not provide you with their members’ addresses, your list is incomplete. This would result in an undercoverage error. Another reason for undercoverage could be that your list is outdated and thus excludes many newly converted farmers. Overcoverage can occur if you made up your sampling frame from different lists, and some farms were included in more than one list. To reduce coverage error, you should thus check for double elements and possibly redefine your sampling frame. The following checklist (according to Dillman 2007) helps you to avoid coverage error.
Checklist: How can you avoid coverage errors?
- The list (sampling frame) is up-to-date.
- The list contains every element of your population of interest.
- The list does not include any elements which are not part of this population.
- Each element is listed only once.
Nonresponse errors occur during data collection, but also play a role in the sampling process. There are two different types of nonresponse errors: unit nonresponse and item nonresponse. Unit nonresponse refers to errors that occur because people in your sampling frame cannot be contacted or refuse to participate in your survey. Item nonresponse occurs if some respondents do not answer one or more questions in a survey. If these different kinds of nonresponse are completely random, they do not pose a problem, except if your sample size is very small. However, nonresponse is problematic whenever it becomes systematic, i.e. when a certain group is underrepresented.
- Example
You are doing a nationwide telephone survey with organic wheat farmers, which you have divided into different clusters according to geographic regions. You decided to collect data from one cluster (region) after the other. Due to problems during data collection, in some regions it has become the main harvesting time when you start collecting your data. In this case it is very likely that many farmers will not answer their telephone, which would then result in (systematic) unit nonresponse (and at the same time lead to coverage error). (Systematic) item nonresponse could occur if some of the questions you asked were unclear, or if farmers were not willing to answer these (e.g. questions on income).
There are two approaches to dealing with unit nonresponse. One way is to reduce the number of noncontacts and refusals by allowing extra time and money for several contact trials. The second way is statistical adjustment after data collection, but this is only possible if you know the difference between respondents and nonrespondents. However, the so-called statistical weighing can be applied for no more than one simple attribute (like farm size, origin etc.). Item nonresponse can be reduced by designing a well-thought-out questionnaire (see Step 7, Questionnaire design).
- Example
If 70% of all organic farms in Germany keep animals and 30% do not keep any animals, but the ratio of the surveyed respondents is 60 to 40, the resulting data related to animal husbandry can be weighed by a factor of 1.1667 (70/60).
Nonresponse figures should always be communicated in reports and publications, as nonresponse has to be considered for representativeness. If nonrespondents systematically differ from respondents, the sample cannot be representative for the population of interest anymore and the results will be biased (Groves et al., 2004). On the website of the American Association for Public Opinion Research (AAPOR), you can download a Response Rate Calculator which includes different categories of nonresponse.
Measurement errors occur during data collection and lead to data which do not reflect the real situation. Measurement errors can arise from respondents giving wrong answers (deliberately or i.e. due to misinterpretation of questions), missing response categories (i.e. no option to state "does not apply") or from interviewers who, through their behaviour, influence the results.
Data handling errors, as the name implies, include errors which occur during reporting, transmitting, storing, or analysing data.
The following checklist includes issues you should consider in order to avoid nonresponse, measurement and data handling errors.
Checklist: How can you avoid nonresponse, measurement and data handling errors?
- The time of data collection is appropriate for the population of interest.
- There is sufficient time for several contact trials.
- All questions in the questionnaire are clearly understandable.
- The response categories cover all relevant answering options.
- The interviewers are well trained and do not influence the respondents.
- Possible sources of error during data transmission, storing and analysis have been checked.
